February 17, 2004. Targeting the Gold Cabal with Silver Bullets
Silver -- the "poor man's gold" -- may soon prove the Achilles' heel of the gold cabal. Connected by nature and history to gold, the older monetary metal by influencing gold may impact interest rates. See Gibson's Paradox Revisited: Professor Summers Analyzes Gold Prices (8/13/2001). Thus any efforts to affect interest rates through the manipulation of gold prices cannot safely ignore silver.
As discussed in prior commentaries and monitored in the Gold Market Regression Charts, J.P. Morgan Chase has long been the major U.S. provider of gold derivatives and a linchpin of the gold cabal. Generally regarded as the Federal Reserve's banker, JPM is the dominant U.S. purveyor of financial derivatives, accounting for fully half of the $67 trillion in total notional value reported by all U.S. commercial banks to the Office of the Comptroller of the Currency as of September 30, 2003. As a percentage of credit exposure to risk-based capital, its derivatives registered at 783% compared to no more than 241% for any other reporting bank.
In a recent article on JPM ("Dollars at risk," Grant's Interest Rate Observer (December 19, 2003), pp. 2-3), the witty and erudite chief editor of that publication noted that while the bank was "the league-table leader in a half-dozen other bankerly attainments," only its derivatives book is "in a position to make the chairman of the Federal Reserve wish he had never been born." However, the article ventured no opinion on a more basic question: Why did the Fed ever permit this extraordinarily risky situation to develop in the first place?
Ostensibly to prevent much of the lucrative business in OTC derivatives from being driven offshore, both the Fed and the Treasury have strongly opposed any significant regulation of it by the Commodity Futures Trading Commission. See Olympic Special: Will the Enron Tar Baby Go for the Gold? (2/6/2002). The resulting regulatory lacunae have left the big derivatives houses with substantial power to push markets around using instruments far beyond the comprehension of ordinary mortals.
Besides their obvious importance to the general economy, interest rates are critical to the pricing of all derivatives. What is more, according to figures from the Bank for International Settlements, as of mid-year 2003 direct interest rate contracts comprised more than two-thirds of the global OTC derivatives market, which then had a total notional value of $170 trillion. With just over 55% of the total $45 trillion in interest rate derivatives reported to the OCC as of September 30, 2003, JPM collected 70% ($2.7 billion) of the total trading revenues ($3.9 billion) generated by these instruments over the first three quarters of last year.
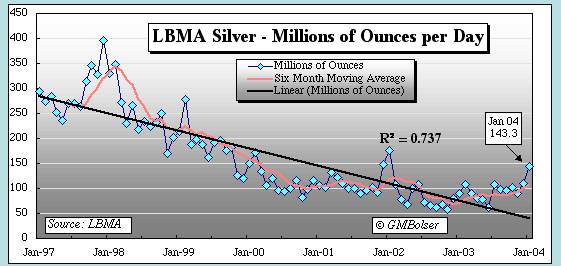
Given the interconnections between the monetary metals, Mike Bolser has regularly included with the Gold Market Regression Charts a chart of monthly average daily silver trading volume at the London Bullion Market Association, the metal's principal physical market. Just updated to include January 2004, the most recent version of this chart appears below.
After putting in a low near 50 million ounces in June 2003, average daily silver volume on the LBMA registered in the area of 100 million ounces for the next six months. Last month it spiked to over 143 million ounces from December's 110 million ounces. While the R^2 value of the long-term declining trend line has fallen marginally from .788 to .737, the short-term divergence from trend is the widest since 1998, suggesting markedly increased investment buying of physical metal.
T* Tremors. Mike concluded his October 2002 article on Preemptive Selling of Gold: The Bigger Picture with a brief, simplified review of Professor Maurice Obstfeld's The Logic of Currency Crises (originally published in Cahiers économiques et monétaires, Banque de France, 1994). In detailing the 1993 currency crises within the European Monetary System, this highly technical paper developed an analytical framework of general applicability to any market for an exhaustible resource where government intervention has prevented prices from rising to sustainable long-term equilibrium levels.
Using a series of formulas, Professor Obstfeld identified T* as the date when the price fixing scheme would meet its inevitable demise, noting that the collapse would typically occur shortly after a speculative attack by private market participants attempting to acquire all of the remaining stock available at the artificially depressed prices.
Sparing us Professor Obstfeld's rigorous mathematics, Mike has provided three additional charts to bolster the hypothesis -- also supported by anecdotal evidence of a tight physical market -- that the past six months of LBMA daily silver volume in excess of its declining long-term trend line may evidence the beginning of just the sort of speculative attack contemplated by Professor Obstfeld.
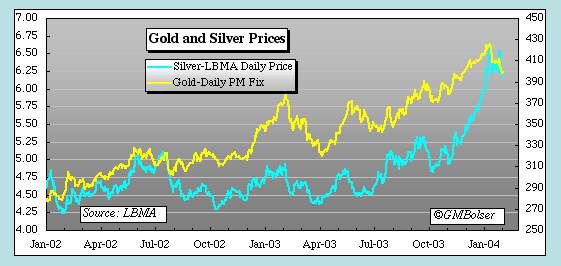
As the following chart shows, gold and silver prices tend to move in generally the same direction, but in recent months the rate of acceleration in silver prices has been much greater than in gold.
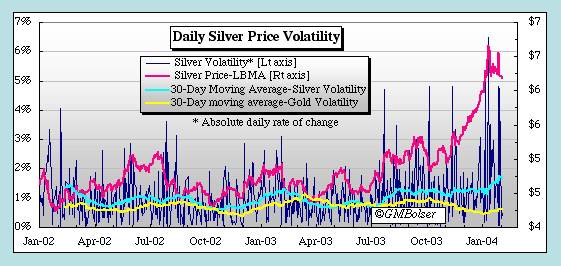
What is more, these sharply rising silver prices have been accompanied by a steep increase in volatility.
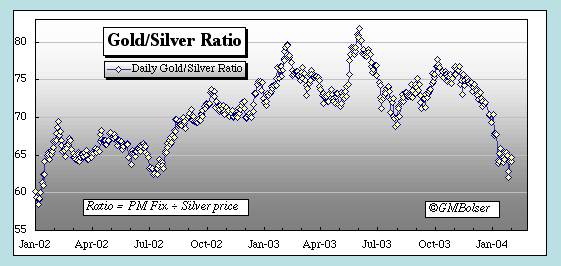
Silver's recent outperformance of gold is also reflected in the gold/silver ratio, which has moved from its most recent highs over 80 to near 60. Still, the ratio is far from its mean over the past two centuries of a little over 30, not to mention the historic norm of 15 to 16 associated with the era of bimetallism. See F. Sanders, The Gold/Silver Ratio Strategy & the Case for Silver, The Moneychanger (March 5, 2003).
Structural Deficit. Analysts may reasonably quibble over the exact amounts of silver produced and consumed each year, but few seriously dispute that since 1990 the world has consumed some 10% more silver than it has produced. This cumulative deficit now approaches 1.5 billion ounces or nearly 47,000 metric tonnes. See, e.g., T. Butler, Making the Case (November 4, 2003) ("For the past 14 consecutive years, silver has remained in a documented supply deficit, verified by a reduction in world inventories of more than 1.5 billion ounces."); F. Sanders, The Cold North Wind, The Moneychanger (December 2003); D. Morgan, Fundamentals & Manipulation of the Silver Market (February 19, 2001).
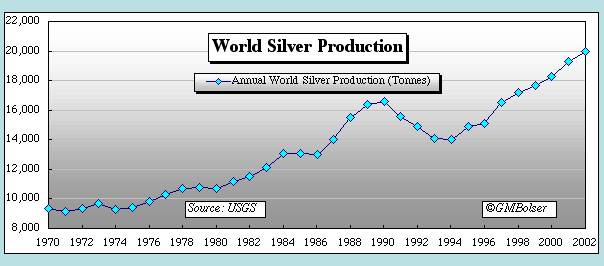
The following chart, which Mike prepared from data published by the U.S. Geological Survey, shows annual world silver production since 1970.
Figures on annual new mine production since 1993 presented by Gold Fields Mineral Services in its World Silver Summary 2003 - A Summary do not record quite as sharp growth over the past decade as the USGS data. GFMS has somewhat higher figures in the earlier years but slightly lower ones more recently. Thus in 2001, GFMS shows total mine production of 589 million ounces (18,327 tonnes) versus the USGS's 19,300 tonnes. For 2002, GFMS has production declining to 586 million ounces (18,224 tonnes) where the USGS shows an increase to around 20,000 tonnes.
At least in recent years, the other major source of physical supply has been scrap. According to GFMS, over the past ten years scrap recovery has run from roughly 150 to 175 million ounces annually, and in 2002 contributed 185 million ounces (5750 tonnes). After scrap, the largest source of supply appears to be government sales, particularly from China. Of net government sales amounting to 87.2 million ounces in 2001 and 71.3 million ounces in 2002, GFMS attributes 68 and 51 million ounces, respectively, to China.
Turning to consumption over the past decade, GFMS shows annual fabrication demand for industrial uses, photography, jewelry and silverware ranging from just under 800 million ounces in 1993-1995 to almost 900 million ounces in 2000 and 838 million ounces (26,000 tonnes) in 2002.
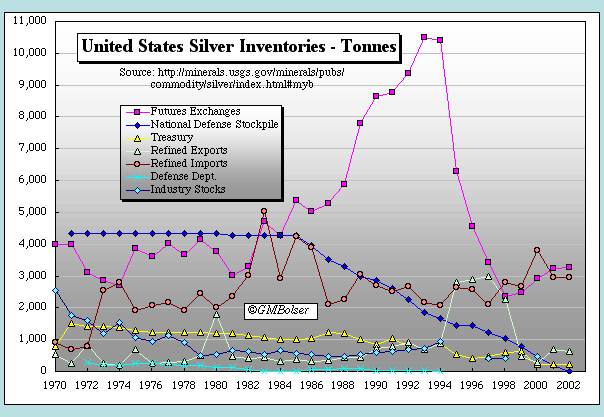
Thus, while scrap may have filled much of the physical deficit in 2002, it cannot have made more than a partial contribution to meeting the cumulative deficit since 1990. The following chart of U.S. silver inventories since 1970 clearly confirms the large role of inventory dishoarding in meeting this deficit during the past decade.
For almost a decade beginning in 1985, reductions in the silver stockpiled for national defense appear to have largely accumulated in growing COMEX and CBOT inventories. Then, in 1994, a massive dishoarding from the exchanges commenced along with both a sharp increase in exports of refined silver and a noticeable reduction of silver held by the Treasury.
Another event of potential (but as yet unproven) importance to the silver market occurred in early 1995. The Clinton administration, through the secretive Exchange Stabilization Fund, engineered a controversial $40 billion financial rescue for Mexico. See J. Turk, More Evidence from 1995, Freemarket Gold & Money Report (October 21, 2001). Mexico is the world's largest silver producer. Thus suggestions that the ESF package contained undisclosed provisions relating to silver as collateral or otherwise were not without a logical basis despite the absence of any hard evidence to support them.
What is known, however, is that exports of silver from Mexico to Britain roughly doubled from their 1994 levels in the next two years. See Glittering exports from Mexico to Britain, Update Mexico (Mexican Embassy to the U.K., February 1997). These, along with the increased silver exports from the United States, presumably were responding to physical demand on the LBMA.
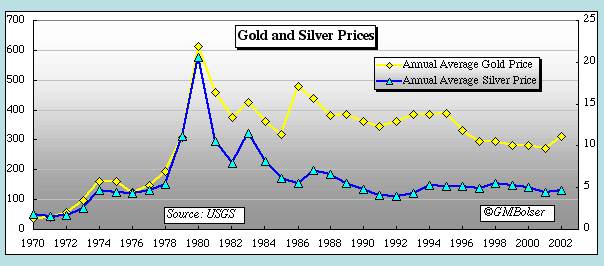
As the following chart indicates, rising trends in the annual average prices of not only silver but also gold were cut off in 1994.
Indeed, as the evidence collected by the Gold Anti-Trust Action Committee amply demonstrates, 1994 marked a watershed for gold. In the middle of the year, coincident with Federal Reserve chairman Alan Greenspan's decision that the Fed should assume the two BIS board seats allocated to the United States, the first wave of preemptive gold selling in excess of three standard deviations occurred on the COMEX. See Complaint, paragraphs 5-6, 50.
China and the Legacy of Bimetallism. An examination of China's place in the modern silver market requires a brief historical review.
Bimetallic monetary systems using gold and silver at a fixed ratio to each other were prone to instability arising from the operation of Gresham's law whenever the market ratio between the two metals diverged more than minimally from the mint or official ratio. What is more, with costs of shipment and storage based primarily on weight, the expenses of physical settlement in silver exceeded those of settling the same transactional amount in gold by a factor approximating the gold/silver ratio. See A. Fekete, Whither Gold? (Bank Lips, 1996).
Due to a general scarcity of gold, these problems remained more or less manageable until the mid-nineteenth century. Then the great gold discoveries in California and Australia, later augmented by those in South Africa, decisively reversed the balance between the two monetary metals. The new abundance of gold soon pushed market ratios below official ratios, drawing gold into the mints for coinage, and causing silver largely to disappear from circulation in the United States and Europe. Displaced from monetary use, growing amounts of Western silver came onto the market, causing prices to drop and a significant portion of the discarded silver to flow to India and the Far East. See R. Jastram, Silver: The Restless Metal (Wiley, 1981), pp. 71-76.
By 1930, China was the largest importer of silver in the world and one of the few nations still on a silver standard, including free and unlimited coinage. The New Deal came to China in the form of higher world silver prices engineered by the Roosevelt administration largely to placate U.S. silver interests and to secure the political support of Senator Key Pittman of Nevada, the powerful chairman of the Senate Foreign Relations Committee. The resulting huge outflows forced China off silver in November 1935, when remaining supplies were nationalized and the country jumped directly to paper money, never passing through a gold standard period as did most Western nations.
If Chinese officials appear deaf to current entreaties to revalue the yuan, they may simply be applying lessons learned from past American conduct, described by Professor Jastram as follows (Silver: The Restless Metal, pp. 98, 100):
A profoundly disturbing example of how one country, for purely domestic reasons, can devastate the economy of another country can be seen by examining the effects of the U.S. silver policy on the Chinese Republic. The history of this sorry episode is replete with governmental clashes at the highest levels, Japanese skullduggery in her expansionist schemes, the collapse of trade in international markets, the ruin of countless Chinese tradespeople and -- it is not too much to add -- starvation among her peoples. Five hundred million people were helpless to stop a juggernaut they could not even see.
* * * * * It is sad to be reminded of popular American comments of the times. These seldom went beyond reiterating the conviction that doubling the world price of silver would double the exchange value of China's stocks of silver and thereby allow her to buy the United States out of the depression. What it did was to drag China in.
The Chinese never joined the exhortation for higher silver. Two economists at the University of Nanking summarized the statements of many when they said, "As long as China remains on a fixed silver standard, those who advocate and work for higher silver values are unconsciously working for declining prices and depression in China."
No reliable figures are available on the amount of China's remaining silver reserves at the end of 1935, or indeed at any subsequent date. Thus, while China is often cited as an important supplier of silver, the size of any remaining Chinese stockpiles is uncertain. In reporting its figures on Chinese government sales in 2001 and 2002, GFMS commented: "2002's decline in Chinese sales was, we believe, more related to the low silver price than exhausted stocks (indeed we have revised upwards our estimate of outstanding Chinese stocks)."
GFMS is entitled to its opinion, but there is no obvious reason to suppose that its estimate of Chinese silver stocks is any more accurate than its implied estimate of the amount of vault gold still held by the world's central banks given its position -- strongly disputed in prior commentaries -- that their gold lending never exceeded much over 5000 tonnes. In any event, how much silver Chinese officials control and why they are doing whatever they are with it must remain at least for the present largely a matter of speculation. But it would be a bit naive to assume that management of Chinese silver inventories is governed solely by principles of rational market behavior and without regard for broader political and strategic interests.
With gold today the universally preferred metal for international monetary reserves, China might reasonably have decided in effect to exchange silver for gold when the prices of both metals were depressed. What is more, if Chinese silver sales assisted efforts by the G-7 to suppress gold prices, China may have been able to obtain additional consideration while covertly stripping Western central banks of some of their gold reserves. More alarming still, inside knowledge of the suppression of gold and silver prices might allow the Chinese in certain circumstances to engineer upside panics in these markets in support other political or strategic objectives.
CRIMEX Silver. As with gold, there is a large paper market in silver that is dominated by derivatives. However, most of the action in silver derivatives appears to take place on the COMEX rather than in the OTC markets. With respect to gold, the elephant in the room that cannot be explained other than as evidence of egregious price manipulation is total OTC derivatives having a notional value almost equal to total official gold reserves reported by all members of the International Monetary Fund. See Gold Derivatives: Hitting the Iceberg (12/20/2003). In silver, there is a similarly inexplicable anomaly: the huge short positions of a few big traders in COMEX options and futures.
Ted Butler has performed for the silver market much the same role that GATA has for gold. His essays on the manipulation of silver prices are collected and archived at http://www.butlerresearch.com/archive_free.html. David Morgan is another silver analyst whose work merits attention and is available online at http://www.silver-investor.com. In Business As Usual? (February 4, 2004), Mr. Butler described recent silver trading on the COMEX:
The just-released Commitments of Traders Report (COT), for positions held as of Tuesday, January 27, 2004, was a shocker for silver. It showed that the commercials increased their net short position in COMEX silver futures and call options to 470 million ounces [14,619 tonnes], an increase of more than 52 million ounces [1617 tonnes] in one week. This is a near-record in the dealers' net short position, exceeded only once before in COT history, some ten years ago. The eight or less largest traders held a net short position of more than 337 million ounces [10,482 tonnes]. There should be no question in anyone's mind as to why we sold off so sharply in silver on Thursday, Jan 29th, when silver fell 40 cents, its biggest decline in many years, and continuing today, Feb. 2. The connection -- largest short position in years, largest price decline in years -- should be painfully obvious to everyone. This is blatant manipulation, pure and simple. There were no fundamental developments in the real world of silver supply and demand, just illegal paper games on the COMEX.
What makes this such an outrage is that these short commercials don't have the real silver backing these naked short sales. How could they? Their total net short position is three times the size of total world known bullion inventories. In no other commodity does this absurd situation exist. In addition, the shorts have struggled for a year to make delivery on the COMEX, consistently forcing some acceptors of delivery to wait until up to the very last delivery day, which is against all known delivery economics. More than 50 million ounces of paper silver shorts were added in the week, even while they struggled to deliver a stinking 5 million ounces of real silver that the Central Fund of Canada bought some 7 weeks ago. And to those who would suggest that this orgy of paper selling was legitimate hedging on the part of miners, since when are legitimate hedges established and liquidated on quick price drops, as is the pattern of the manipulative shorts?
The following chart by Don Lindley tracks the short positions on the COMEX from the beginning of 1993. Note that the right axis is in number of contracts, and thus must be multiplied by 5000 to arrive at ounces (e.g., 90,000 contracts x 5000 = 450 million ounces or almost 14,000 tonnes). Comparing this chart to Mike Bolser's showing U.S. silver inventories, it is apparent that total net short positions reached historic highs just before the sharp drawdown of U.S. inventories began in 1994, and that these positions declined with inventories through 1999 and into 2000.
Since 1998, with inventories on U.S. futures markets stabilizing at around 3000 tonnes and U.S. official stockpiles essentially exhausted, the net short position of the commercial longs -- largely the big international banks also associated with the gold cabal -- has climbed almost to the historic highs of 100,000 contracts (500 million ounces or roughly 15,500 tonnes) reached in 1994. But where that earlier short position was backed by inventories plus official stockpiles totaling nearly 14,000 tonnes, today's short position can call on inventories that since 1998 have, as already noted, averaged a mere 3000 tonnes.
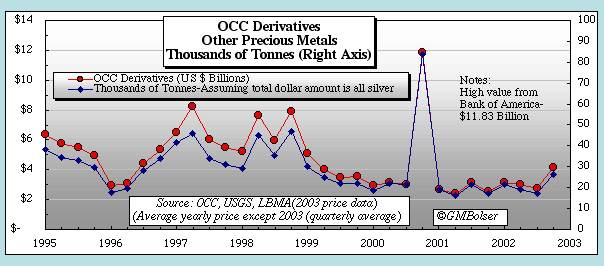
This massive short position on the COMEX does not exclude the possibility that OTC derivatives have also played a role in the suppression of silver prices, but their role cannot be documented as it can with gold. The regular reports on worldwide OTC derivatives published by the BIS do not permit the separate identification of silver derivatives even indirectly. As shown in the following chart, the derivatives figures published by the OCC for U.S. commercial banks show a generally declining trend over the past several years in derivatives on precious metals other than gold. However, non-gold derivatives jumped sharply in the third quarter of 2003 from $2.7 to $4.1 billion in notional value. Were that increase entirely in silver, at $5 per ounce it would amount to 280 million ounces. [Note: As of year-end 2003, the OCC reported other precious metals derivatives of $4.2 billion.]
Of course, it is quite possible that a significant part of the massive reduction in total U.S. silver inventories and stockpiles from 1994 through 2000 took place through leasing, at least as an intermediate step. Unlike the many central banks that keep leased bullion on their books as if it were still in their vaults even though it has in fact been sold into the market, futures exchanges cannot record leased bullion that has left their warehouses as still in inventory. Because most leased gold came from central banks, leasing never appeared to reduce the pool of metal still available for lease. But most leased silver necessarily came out of private inventories, shrinking the published size of the remaining pool and thereby indicating at least to the prudent a need to reduce their OTC derivative commitments.
Taken together with accumulating anecdotal evidence of severe tightness in the market for physical silver, the picture that emerges suggests an organized effort to transfer as much speculative, investment and monetary demand for silver as possible to the paper markets, particularly the COMEX, and begs the question: Who is ultimately shouldering the risk of this massive short position and why?
The most likely answer is that the big COMEX silver shorts are backed by the same financial muscle and mob as the gold cabal. The derivatives markets for silver, gold and interest rates are uniquely characterized by the same anomaly: strikingly massive and extraordinarily risky positions concentrated in one or a few very large and politically well-connected international banks. What is more, it is virtually inconceivable that any sane or competent regulatory regime -- in ordinary course and absent some extraordinary pressures or considerations -- would allow positions of such size and risk to develop.
Recently GATA threw its support behind Mr. Butler's campaign to inundate CFTC and COMEX officials with investor demands to clean up silver trading on what is now widely perceived as the CRIMEX. Alternatively, silver investors are urged to bring their complaints to Eliot Spitzer, Attorney General of the State of New York, who has made quite a name for himself by forcing some long-needed reforms on Wall Street.
The Butler/GATA campaign may be urging the most improbable confrontation since David took on Goliath: a modern Lone Ranger against Uncle Sam and his powerful banking minions. Realistically, the campaign is a long shot. But bullets from an exploding silver market could do real damage to the gold cabal. Hi-ho Silver, away!