CURRENT COMMENTARIES May 25, 2009 (RHH). Gold Derivatives: The Tide Turns
There is a tide in the affairs of men
Which, taken at the flood, leads on to fortune;
Omitted, all the voyage of their life
Is bound in shallows and in miseries.
On such a full sea are we now afloat,
And we must take the current when it serves,
Or lose our ventures.Shakespeare, Julius Caesar, Act 4, scene 3, lines 218–224 (Brutus to Cassius)
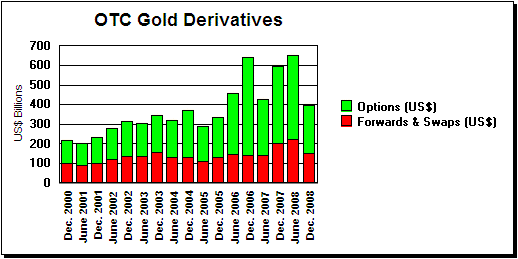
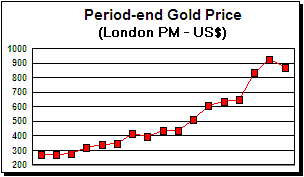
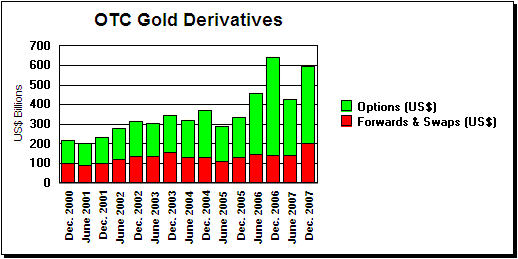
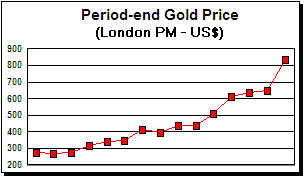
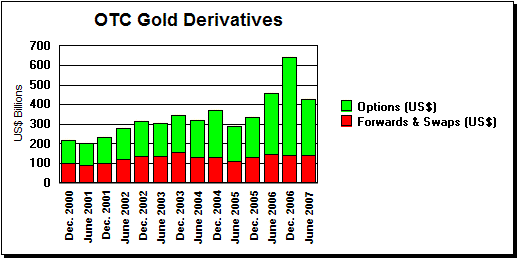
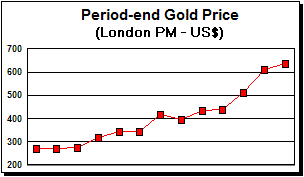
On May 19, 2009, the Bank for International Settlements released its regular semi-annual report on the over-the-counter derivatives of major banks and dealers in the G-10 countries and Switzerland for the six months ending December 31, 2008. See A. Moses, Derivatives Market Declines for First Time on Record (Update1), Bloomberg.com (May 19, 2009). The total notional value of all gold derivatives declined from $649 billion at mid-year to $395 billion at year-end, or almost 40%. Although gold prices fell from $930 to $870 (London PM) during the period, gross market values dropped only marginally from $68 to $65 billion, probably reflecting the impact of increased volatility on valuing options.
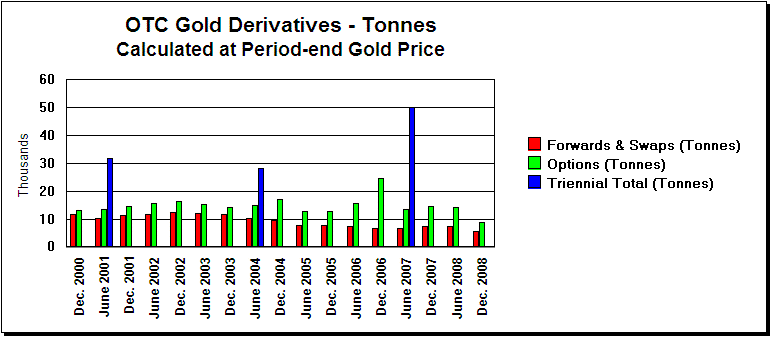
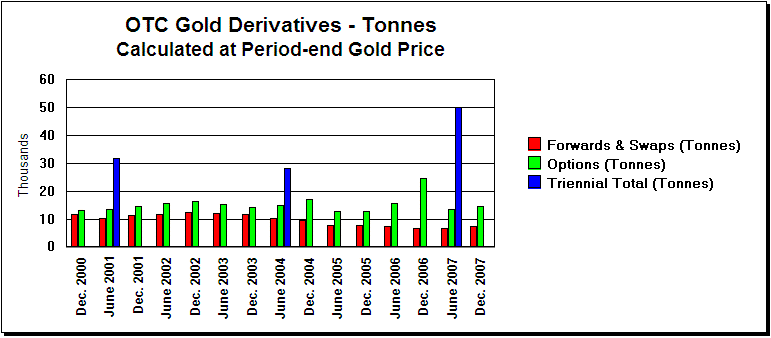
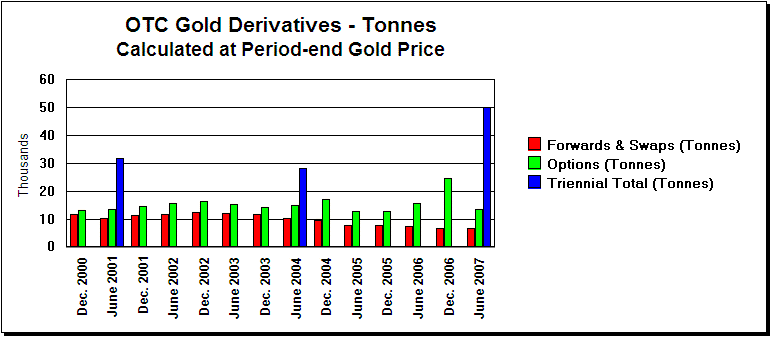
As detailed in table 22A, forwards and swaps declined from $222 to $152 billion, and options from $428 to $243 billion. Converted to metric tonnes at period-end gold prices, total gold derivatives dropped by almost 7600 tonnes during the last half of 2008, with forwards and swaps falling nearly 2000 tonnes to somewhat over 5400, and options by over 5600 tonnes to almost 8700. This data is shown graphically in the three charts below, all updated versions of prior charts in previous commentaries on the same subject.
The significant declines in worldwide gold derivatives reported by the BIS for the last half of 2008 stand in stark contrast to the figures for U.S. commercial banks reported by the Office of the Comptroller of the Currency. From June 30 to December 31, 2008, the total notional amount of gold derivatives held by U.S. commercial banks fell from $114 billion to $107 billion, or just over 6%, compared to the 40% drop for all major banks and dealers in the G-10 plus Switzerland. JP Morgan Chase's gold derivatives fell from $85.3 to $82.5 billion, scarcely 3.3%, and HSBC's from $27.5 to $19.2 billion.
As argued in numerous earlier commentaries on gold derivatives, the best approximation of the total net short physical position in gold arising largely as the result of gold lending in one form or another by central banks is the total notional value of gold forwards and swaps as reported by the BIS and converted into tonnes. Accordingly, the recent data suggests that this short position was reduced by some 2000 tonnes in the last half of 2008, and that as a consequence of the fall financial crisis, official gold lending is now definitely on the ebb even if, like a modern King Canute, the Federal Reserve and JP Morgan Chase are trying to stand against the tide.
Most of the reductions almost certainly stem from unwinding positions in the gold carry trade since producer hedge books were substantially cut back in earlier periods. According to Gold Fields Minerals Services, the global delta-adjusted producer hedge book fell by 358 tonnes in 2008, but nearly half of this amount reflected declines in options rather than forwards and gold loans. See GFMS & Société Générale, Global Hedge Book Analysis (Q4-2008) (March 2009). Nor does it appear that significant quantities of these forwards and swaps were converted into outright sales. In fact, gold sales by the official sector slowed. See V. Brown et al., Third gold sales pact to plant flag of support, Reuters UK (April 30, 2009) (alternate link).
Accordingly, cover for most of the 2000 tonnes presumably came through market purchases, adding to already strong demand. Particularly with respect to bullion coins and small bars, reports of shortages and delivery delays are legion. J. Blas, Gold coin shortage as demand soars, FT.com (Feb. 25, 2009) (alternate link). China, now the world's largest gold producer, recently admitted to large additions to its official gold reserves primarily from domestic production. C. Oliver, China's gold reserves jump, making nation No. 5 holder, MarketWatch (April 24, 2009). Gold ETFs, which now claim to hold over 1300 tonnes, continued to add to their positions. See J. Nichols, Surge in growth in gold ETF holdings has potential downside too, Mineweb (Feb. 12, 2009).
Derivatives can be and are used to push markets around. Nowhere has this phenomenon been more obvious than in the gold market, where as former Federal Reserve chairman Alan Greenspan boasted to the House Banking Committee in 1998: "...central banks stand ready to lease gold in increasing quantities should the price rise." Gold lending by central banks provided the fuel for gold derivatives, particularly forwards and swaps, and the ammunition used by the bullion banks to suppress gold prices, thereby making the U.S. dollar and other major currencies appear sounder than their fundamentals warranted.
However, governments and central banks that try to push interest rates below the lease rates normally associated with gold (i.e., 1%-2%), particularly if they do so during periods of severe financial stress when gold lease rates have a natural tendency to spike, are engaged in a battle against common sense. Fundamentally, and in the face of all historical evidence, they are trying to assert that their fiat currencies are a better and more enduring store of value than permanent natural money of gold. It isn't so, and never will be, at least "...until the fiat of the Almighty shall evolve laws in the universe radically different from those which at present obtain." A.D. White, Fiat Money in France (Foundation for Economic Education, 1959), p. 109.
A free gold market displays two essential characteristics. First, in accordance with Gibson's Paradox, gold prices move inversely to real long-term interest rates. See Gibson's Paradox and Rising Rates (7/20/2007). Second, gold futures are in contango. That is, for any given maturity, Libor (the London interbank offered rate) minus the gold lease rate yields a gold forward rate (GOFO) that is positive. See The Golden Sextant (1991). The London Bullion Market Association uses this formula to derive lease rates from quoted GOFO rates. Between November 20 and 24, 2008, at the height of the financial crisis, the LBMA reported that GOFO for the one and two month maturities actually turned negative.
This development not only indicated great stress in the gold market but also precipitated much discussion and commentary about gold in backwardation and the implications thereof. As discussed in the The Golden Sextant, gold is arbitraged along with currencies on the basis of relative interest rates where those with lower interest rate structures are in contango against those with higher rates, and those with higher rates are in backwardation against those with lower rates. In normal circumstances, gold lease (interest) rates are lower than those on any fiat currency because gold incurs no charge for potential debasement (inflation).
Under the post-Bretton Woods international currency regime of fiat currencies and floating exchange rates with the U.S. dollar as primus inter pares, gold has lived more or less harmoniously alongside and been arbitraged against the major currencies. But gold flirting with backwardation is evidence of the impending failure of that system. The futures markets for gold are far more likely to close than gold is to go into significant backwardation. Selling gold at spot and simultaneously buying it back for future delivery at a lower price is free money, i.e., a deal that is too good to be true.
Alternatively, the futures markets for gold might remain open, but prices would be set as they are for other commodities rather than on the basis of relative interest rates. Ironically, then, gold trading as an ordinary commodity may be the last step to a general loss of confidence in all unlimited paper currencies and the restoration of gold to the world's monetary throne.
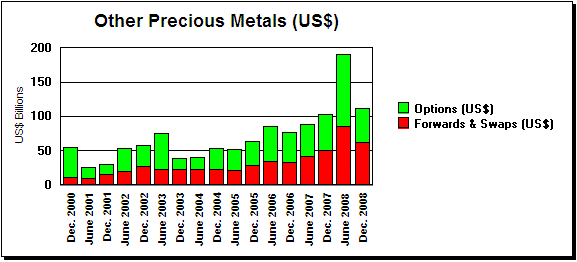
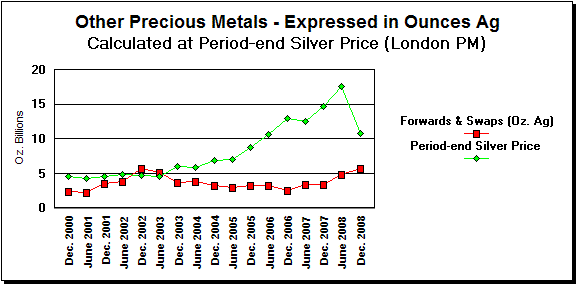
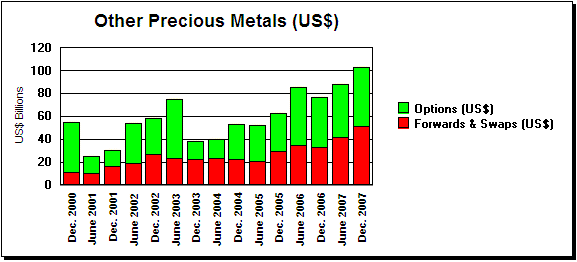
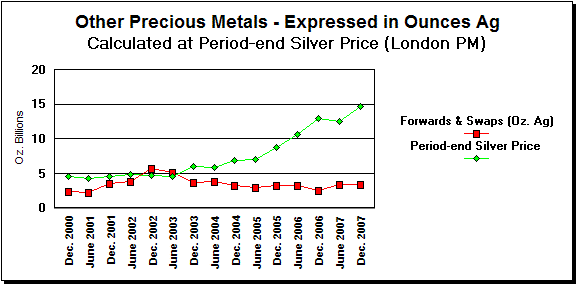
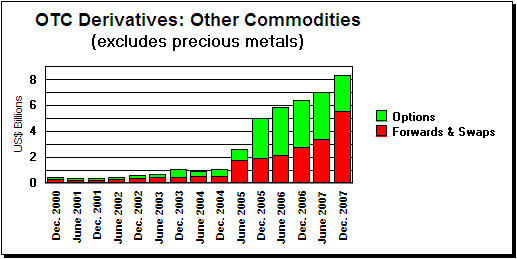
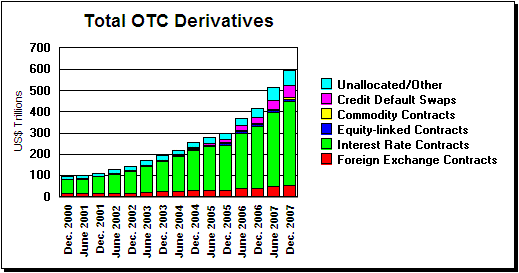
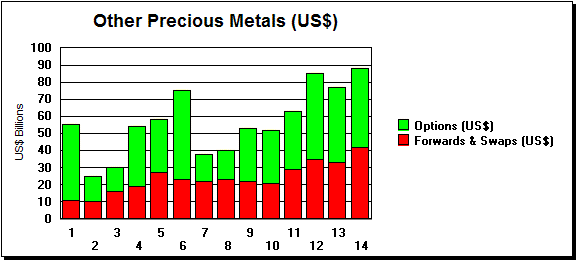
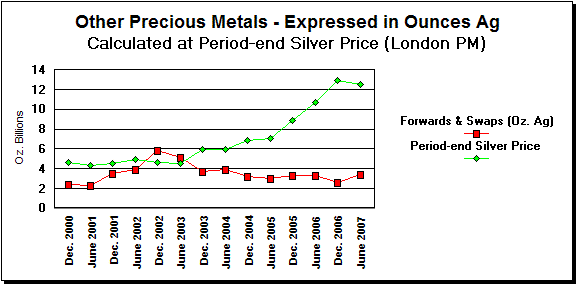
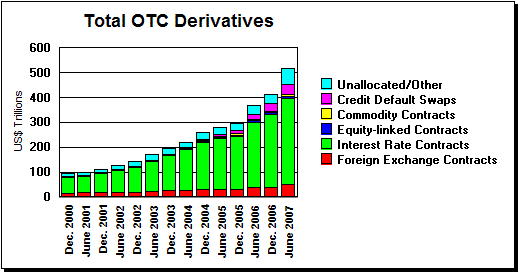
Addendum. For those interested, updates of the other charts on OTC derivatives contained in prior commentaries are reproduced below. Interestingly, expressed in ounces of silver, forwards and swaps on other precious metals actually rose slightly as silver prices declined by more than the corresponding dollar volumes.
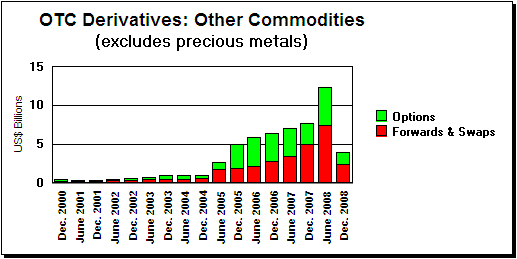
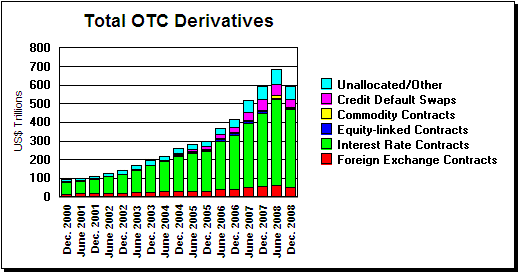
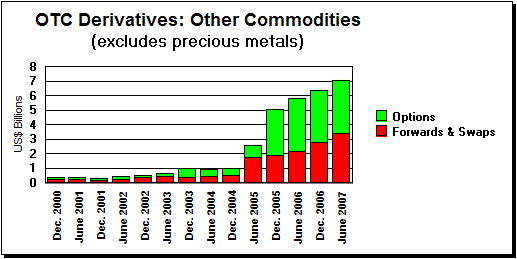
Otherwise, there were declines across all categories, with an especially sharp drop in derivatives on other commodities (excluding precious metals). Buffered by a relatively modest decline in interest rate derivatives, by far the largest category, total OTC derivatives fell by nearly $100 trillion to just under $600 trillion.
On another front, during 2008 total earmarked gold held by the New York Fed for foreign and international accounts, mostly foreign central banks, declined by a net 220 tonnes, from $8,710 to $8,412 million at $42.22/ounce, or from 6417 to 6197 tonnes, but since the end of the year has remained unchanged.
June 1, 2008 (RHH). Gold Derivatives: Moving Up Again
On May 22, 2008, the Bank for International Settlements released its regular semi-annual report on the over-the-counter derivatives of major banks and dealers in the G-10 countries and Switzerland for the six months ending December 31, 2007. The total notional value of all gold derivatives climbed from $426 billion at mid-year to $595 billion at year-end. Gross market values increased from $47 to $70 billion over the same period, while gold prices rose from $651 to $837 (London PM).
As detailed in table 22A, forwards and swaps increased from $141 to $200 billion, and options from $285 to $395 billion. Converted to metric tonnes at period-end gold prices, total gold derivatives climbed by more than 1750 tonnes during the last half of 2007, with forwards and swaps rising almost 700 tonnes and options over 1050 tonnes. This data is shown graphically in the three charts below, all updated versions of prior charts on the same subject.
According to Gold Fields Minerals Services, at September 30, 2007, the global delta-adjusted producer hedge book had fallen to just over 1000 tonnes, with a "sizable cut" in forward sales during the third quarter being partially offset by increases in options. GFMS, Global Hedge Book Analysis (Q3-2007) (November 2007). At the same time, citing low lease rates and growing concerns over counterparty risk, GFMS asserts: "Over the course of 2007 central banks continued to withdraw from the [gold] lending market." GFMS, Official Sector Activity in Gold: Full Year 2007 (January 2008), p. 7.
No doubt a prudent central banker would behave just as GFMS suggests. But the data from the BIS on gold derivatives in 2007 begs the question: If the producers were continuing to dehedge and the central banks were reducing their gold lending, what accounts for the rising tonnages of gold forwards and swaps?
This question suggests another: What is the Fed hiding by stonewalling on GATA's requests under the Freedom of Information Act for "copies of all records in the possession or control of the Federal Reserve Board relating to, explaining, denying or otherwise mentioning 'gold swaps' involving the United States of America or any agent thereof, during the time period January 1, 1990, to December 7, 2007, the date of the request?" See GATA's Letter of Appeal (May 5, 2008).
Addendum. For those interested, updates of the other charts on OTC derivatives contained in the prior commentaries are reproduced below.
November 30, 2007 (RHH). Gold Derivatives: Options Galore
On November 21, 2007, the Bank for International Settlements released its regular semi-annual report on the over-the-counter derivatives of major banks and dealers in the G-10 countries and Switzerland for the period ending June 30, 2007. The total notional value of all gold derivatives came in at $426 billion, $37 billion less than previously reported for year-end 2006 but a whopping $214 billion less than the revised year-end figure. Period-end gold prices increased from $636 to $651 (London PM). Gross market values fell to $47 billion from an unrevised $56 billion.
As detailed in table 22A, forwards and swaps rose marginally to $141 billion from $139 billion, also unrevised. Options, however, fell from a revised $501 billion to $285 billion. The previously reported year-end 2006 figure for options was $324 billion, $177 billion less than the revised number. In the past, although there have been occasional minor adjustments in the data for the prior six months, none have been close to this magnitude.
Converted to metric tonnes at period-end gold prices and based on the revised data for year-end 2006, total gold derivatives rose by nearly 8,200 tonnes in the last half of 2006, and then fell by 10,495 tonnes in the first half of 2007. Forwards and swaps, which declined just over 700 tonnes in the second half of 2006, fell another roughly 60 tonnes in the first half of 2007. Options, which rose almost 8,900 tonnes in the last half of 2006, fell nearly 10,900 tonnes in the first half of this year.
At the same time that it released its regular semi-annual report on the OTC derivatives of major banks and dealers in the G-10, the BIS also released the first part of its regular triennial survey on OTC derivatives of a wider universe of market participants from some 50 jurisdictions. This report, too, contained an eye-popping number. According to Table A, total gold derivatives over the three-year period rose from $359 billion at end-June 2004 to $1,051 billion at end-June 2007, or in tonnes at period-end gold prices, from 28,200 to 50,250.
The data is summarized graphically in the three charts below, updated from the prior commentary on this subject. For the G-10 and Switzerland, total forwards and swaps now stand at approximately 6,800 tonnes, options at 15,850 tonnes, and total gold derivatives at 22,650 tonnes. The triennial survey, or at least the first part of it, does not provide separate data for forwards and swaps and for options. Due to the wide intervals between these reports, the triennial totals are shown only in tonnes in the third chart.
The $177 billion upward revision in year-end 2006 OTC gold options equates to over 8,450 tonnes in notional value. According to an e-mail message from the BIS, "two reporting countries provided revisions" for year-end 2006, with "mainly one reporter" responsible for the adjustment to gold options. Since country data is confidential, the BIS declined to provide any further detail. However, to identify any single reporting country that might even under extraordinary circumstances be "mainly" responsible for an error of this magnitude is far from easy.
Data published annually by the Swiss National Bank shows total precious metals derivatives of all Swiss banks as of year-end 2006 at CHF 151 billion, or approximately US$123 billion at the year-end exchange rate (CHF 1.225 = US$1.00). Of this amount, CHF 91 billion (US$74 billion) were in options. Data published by the Office of the Comptroller of the Currency on the gold derivatives of U.S. commercial banks (primarily J.P. Morgan Chase, HSBC Bank USA and Citibank) shows total gold derivatives at year-end of $94 billion. What is more, the OCC reports this data quarterly, and neither the report for the first nor for the second quarter of 2007 shows any revisions to the 2006 year-end data.
Accordingly, the finger of suspicion with respect to the reporting snafu seems to point in the direction of one or more big U.S. investment banks, e.g., Goldman Sachs, which are not included in the OCC data. But whoever the culprit, the numbers themselves suggest that the gold options involved in the revisions have now been transferred to market participants outside the regular semi-annual reporting system but covered by the triennial survey.
Indeed, it would appear that these options were never intended to be picked up in the regular semi-annual report. One plausible hypothesis is that one or more big U.S. investment banks are effectively running large gold options books through non-reporting entities covered only in the triennial survey, and that due to errors of accounting, timing or otherwise, these banks were forced by their auditors to recognize on their own books at year-end gold options that they believed were on the books of others.
Another intriguing development of the past few months is the resumed outflow of foreign earmarked gold from the United States. From the end of 2003 through January of this year, there was virtually no change in the total amount of gold held under earmark at the New York Fed for foreign and international accounts, mostly foreign central banks. However, from February through September, the latest month for which figures are available, these accounts are down by a net 169 tonnes, from $8,967 to $8,737 million at $42.22/ounce, or from 6,606 to 6,437 tonnes.
Both the explosion in gold options and the resumed exports of foreign earmarked gold suggest that managing the gold price is becoming an ever more difficult task. No surprise, then, that gold prices have turned sharply upward during the second half of the year. However, the price managers still have one thing operating in their favor: the apparent willingness of hedge funds and other supposedly sophisticated large players to make their bets on gold through paper derivatives, not the acquisition of physical metal.
The reported figures indicate that the mountain of gold options now almost certainly exceeds 30,000 tonnes -- an amount roughly equal to the world's total claimed official gold reserves. How many of these options are cash settlement only? Have the bullion banks actually committed to delivering physical gold in anything like these notional amounts? Northern Rock reminded the world that there's no run quite like a bank run. The parties to these OTC gold options risk an unpleasant reminder of the corollary: there's no rush quite like a gold rush when confidence in paper currency evaporates.
Addendum. For those interested, updates of the other charts on OTC derivatives contained in the prior commentary are reproduced below.
September 15, 2007. New Section: "All that Glisters..."
'All that glisters is not gold,
Often have you heard that told;
Many a man his life hath sold
But my outside to behold:
Gilded tombs do worms infold.
Had you been as wise as bold,
Young in limbs, in judgment old,
Your answer had not been inscroll'd:
Fare you well, your suit is cold.'

  Note found by the Prince of Morocco on unlocking the golden casket
  From W. Shakespeare, The Merchant of Venice, Act II, Scene 7
The unfolding collapse of the fiat monetary system makes fascinating theater. However, notwithstanding the recent improvement in the gold price as expressed in Federal Reserve Notes, the gold market continues to remain firmly in the grip of the central banks and their agents. Watching the antics of the gold cartel has for us become a bit of a bore; same old, same old. We don't know how much longer their control can last; recent developments suggest we may not have long to wait. In the meantime, we have lives to live, things to do, friends to visit, and places to see. Some of these activities may interest others, and where that seems likely, and even where it doesn't and we still feel like it, we may write about them. Unrelated to the site's main theme, these articles will be posted in a new section: "All that Glisters...". To launch this section, Reg has written an account of his recent motorcycle trip across Labrador, Wee-Strom in Labrador.
July 20, 2007 (RHH). Gibson's Paradox and Rising Rates
Rising interest rates and worries about inflation are back in the news. See, e.g., A. Evans-Pritchard, As 'China effect' reverses, inflation threaten, Telegraph.co.uk (July 7, 2007). What do these developments portend for gold prices? According to Gibson's paradox, gold prices in a free market move inversely with real long-term interest rates. See Gibson's Paradox Revisited: Professor Summers Analyzes Gold Prices (8/13/2001).
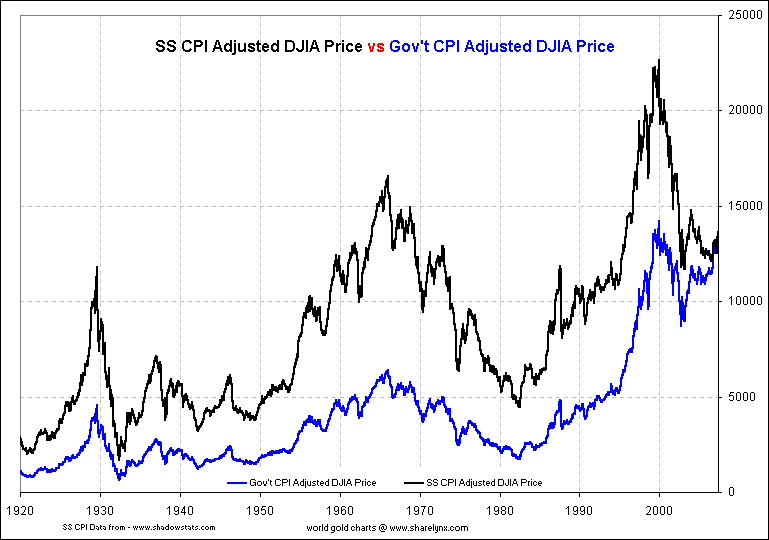
To illustrate, Nick Laird, the proprietor of www.sharelynx.net, prepared a chart tracking real interest rates against gold prices, inverting the later so that both measures would be moving in roughly the same direction assuming the operation of the paradox. Nick provided an updated version of that chart last year for Gold Derivatives: Da Goldman Code (6/21/2006). In both instances, real rates were represented by the 30-year T-bond yield less the government's consumer price index.
But is the official CPI the best or even an accurate measure of inflation? What is the purpose of excluding food and energy from so-called "core" inflation? See, e.g., S. Malone, Bernanke: Anchored expectations mute price swing, Reuters (July 10, 2007). Don't drink and drive makes sense. Don't eat or drive (or heat your home in winter) is impossible.
John Williams at Shadow Government Statistics (www.shadowstats.com) asks: "Have you ever wondered why the CPI, GDP and employment numbers run counter to your personal and business experiences? The problem lies in biased and often-manipulated government reporting." Accordingly, he calculates various corrected economic series, and has generously provided his corrected CPI data (the "SS CPI") to Nick for use in the following charts.
The first shows nominal gold prices charted against real rates as calculated from both the official CPI and the SS CPI. The second shows constant dollar gold prices in current dollars calculated from the official CPI against real rates based on that index. The third shows constant dollar gold prices in current dollars calculated from the SS CPI against real rates based on that index.
In addition, Nick used the Williams' data to prepare some additional charts, two of which touch on subjects discussed in prior commentaries: the relationship between gold prices and both the Dow Jones Industrial Average and oil prices. See Gold Derivatives: Chinese Torture (6/11/2007); Free Gold: Grease the Banks (8/09/2005); Dow/Gold Ratio (12/2000).
Using the SS CPI, the DJIA despite some ups and downs has largely been treading water since 1969, and now rests just marginally above its 1929 high.
As for oil prices, in real terms under the SS CPI they are far from their highs of the late 1970's early 1980's, perhaps helping to explain why recent increases have not caused anywhere near the same slowing of the real economy as in that earlier period.
Returning to Gibson's paradox, the key point to bear in mind about gold prices is that they move inversely to real rates, not nominal rates, so that rising rates become a threat to gold prices only when long-term rates move up at a faster clip than inflation, properly measured. When nominal rates rise in response to inflationary pressures but at a slower pace than prices generally, gold should do well.
The gold bull market that peaked in 1980 with negative real rates around minus two percent did not conclusively enter bear territory until real rates exceeded eight percent as measured by the official CPI. Taking their current mid-point between the CPI and the SS CPI calculations as shown on Nick's most recent chart, real rates today are in roughly the same negative range as they were in 1980.
Looking to the future track of gold prices, Gibson's paradox suggests that both gold prices and real rates have considerable room to rise before returning to their relative historical norms. It also raises some disquieting questions. Is helicopter Ben Bernanke really a wolf in sheep's clothing, just waiting for the right moment to act like Paul Volcker? What effect would real rates of six to eight percent have on today's highly leveraged economy? When the cure is worse than the disease, the addiction is likely terminal. So it is with alcohol and drugs. So it has always been with governments that have overdosed on unlimited paper money.